Collapsible Tool Output
Press Ctrl+O after an investigation completes to enter tool review mode. This lets you inspect every tool call and its results — expand individual calls to see the raw data returned by your telemetry sources, or collapse them to focus on the analysis.
How it works
- Run an investigation (ask a question or use a slash command)
- After the investigation completes, press
Ctrl+O - Use
↑↓to navigate between tool calls - Press
Enterto expand/collapse a tool call - Press
Ctrl+OorEscto exit review mode
What you see
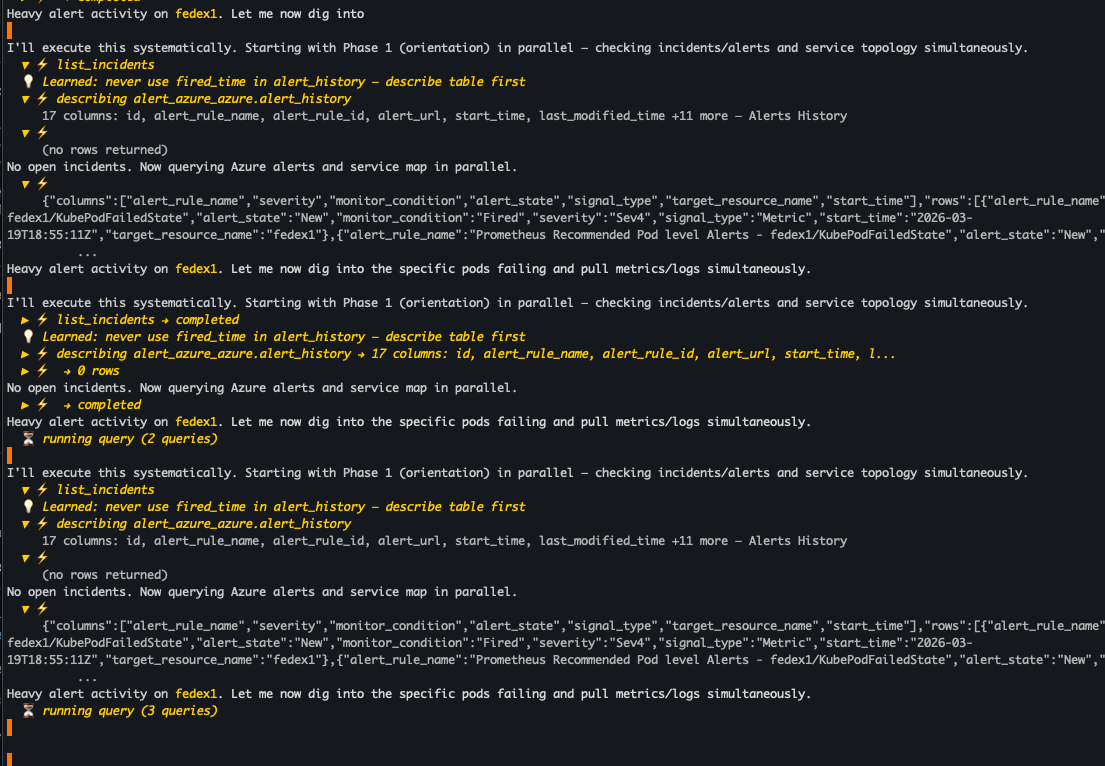
Each tool call shows:
- Tool name — which tool was used (e.g.,
list_incidents,describe_table,search_tables_regex) - Reason — why NeuBird chose to run this query
- Input — the query parameters or search pattern
- Output — the raw results (JSON) returned by the data source
- Learned rules — if NeuBird has learned something about your data source (shown in yellow), such as "never use
fired_timein alert_history — describe table first"
Failed or exploratory queries are automatically hidden in the collapsed view but visible when expanded. This is how NeuBird's exploratory probes work — it tries queries that might fail and adapts based on what it learns.
A note on the query language
You'll notice that tool calls in the TUI show queries that look like SQL. NeuBird uses SQL as a universal data access layer — a common language for querying across all your telemetry sources. Behind the scenes, these queries are translated by Foreign Data Wrappers into native API calls for each data source:
| What you see in the TUI | What actually happens |
|---|---|
SELECT * FROM pagerduty_prod.incidents |
PagerDuty REST API call |
SELECT * FROM metric_datadog.cpu_utilization |
Datadog Metrics API query |
SELECT * FROM alarm_aws_prod.alarm |
AWS CloudWatch DescribeAlarms |
SELECT * FROM trace_grafana_tempo.spans |
Tempo TraceQL query |
SELECT * FROM log_grafana_loki.logs |
Loki LogQL query |
This means you don't need to know SQL — NeuBird handles the query generation. The SQL is shown for transparency so you can see exactly what data NeuBird is accessing during an investigation.
Why it matters
Tool review gives you full transparency into NeuBird's reasoning:
- Verify findings — check that the right data sources were queried and the results support the conclusions
- Understand the investigation — see which telemetry sources NeuBird found useful and what order it explored them
- Debug unexpected results — if an investigation produces something unexpected, expand the tool calls to find where the reasoning diverged
- Share evidence — the raw data backing each finding is right there, ready to copy and share with teammates